

Heading into 2026, investor sentiment was overwhelmingly optimistic. Markets were buoyant, economic conditions appeared favorable, and expectations for continued growth were high. However, that optimism was quickly disrupted.
On February 28, 2026, the Iran War began with Operation Epic Fury and the assassination of Iranian Supreme Leader Ali Khamenei. Since then, investor attention has been dominated by uncertainty surrounding the conflict, accompanied by a noticeable rise in market volatility.
Prior to the outbreak of hostilities, the S&P 500 Index stood at 6,878.88. Over the following 30 days, the index declined 7.8%, falling to 6,343.72 by March 30, 2026. Yet, just as quickly as the market fell, it rebounded – recovering to 6,886.24 by April 13. This marked a full recovery within just two weeks of the low and only 44 days after the initial event.¹
This naturally raises an important question: how does this period compare to past geopolitical conflicts?
Interestingly, the recent volatility aligns closely with historical patterns. As noted by LPL Financial, “Even in the face of more serious and prolonged geopolitical events, the stock market has demonstrated remarkable resilience. On average, the S&P 500 experiences a drawdown of approximately 7% and recovers within about 55 days.” Our current experience fits well within these historical averages.
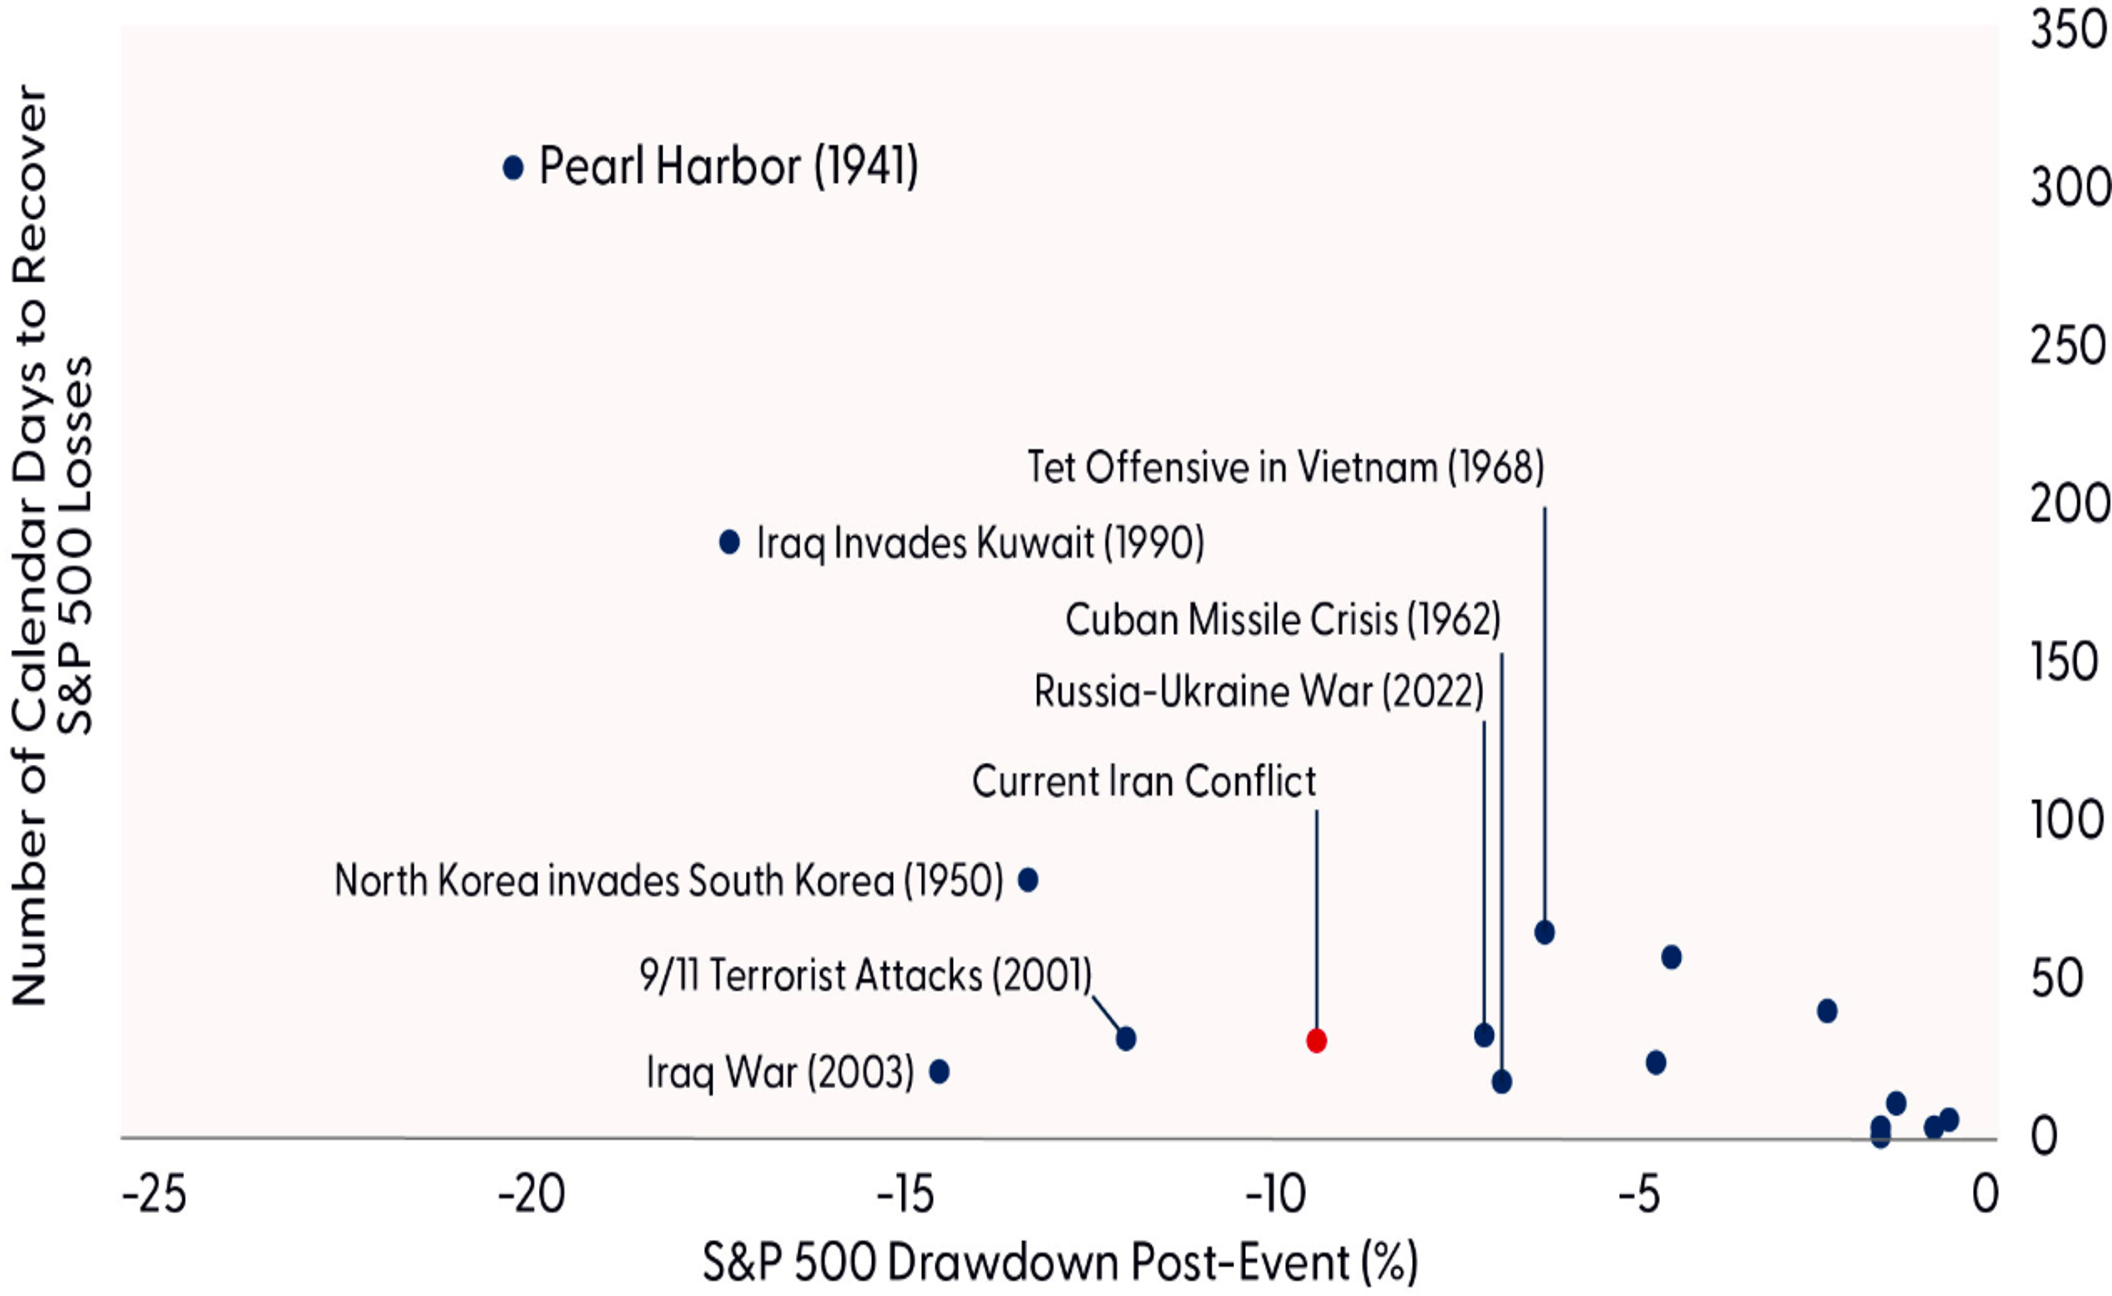
Disclosure: All indexes are unmanaged and cannot be invested in directly. Past performance is no guarantee of future results. Events not labeled include Hungarian uprising ('56), Suez crisis ('56), Gulf of Tonkin Incident ('64), Six-Day War ('67), Yom Kippur War ('73), Israel-Hamas War ('23), U.S.-Israeli Airstrikes of Iran Nuclear Sites ('25). The modern design of the S&P 500 stock index was first launched in 1957. Performance back to 1950 incorporates the performance of the predecessor index, the S&P 90.
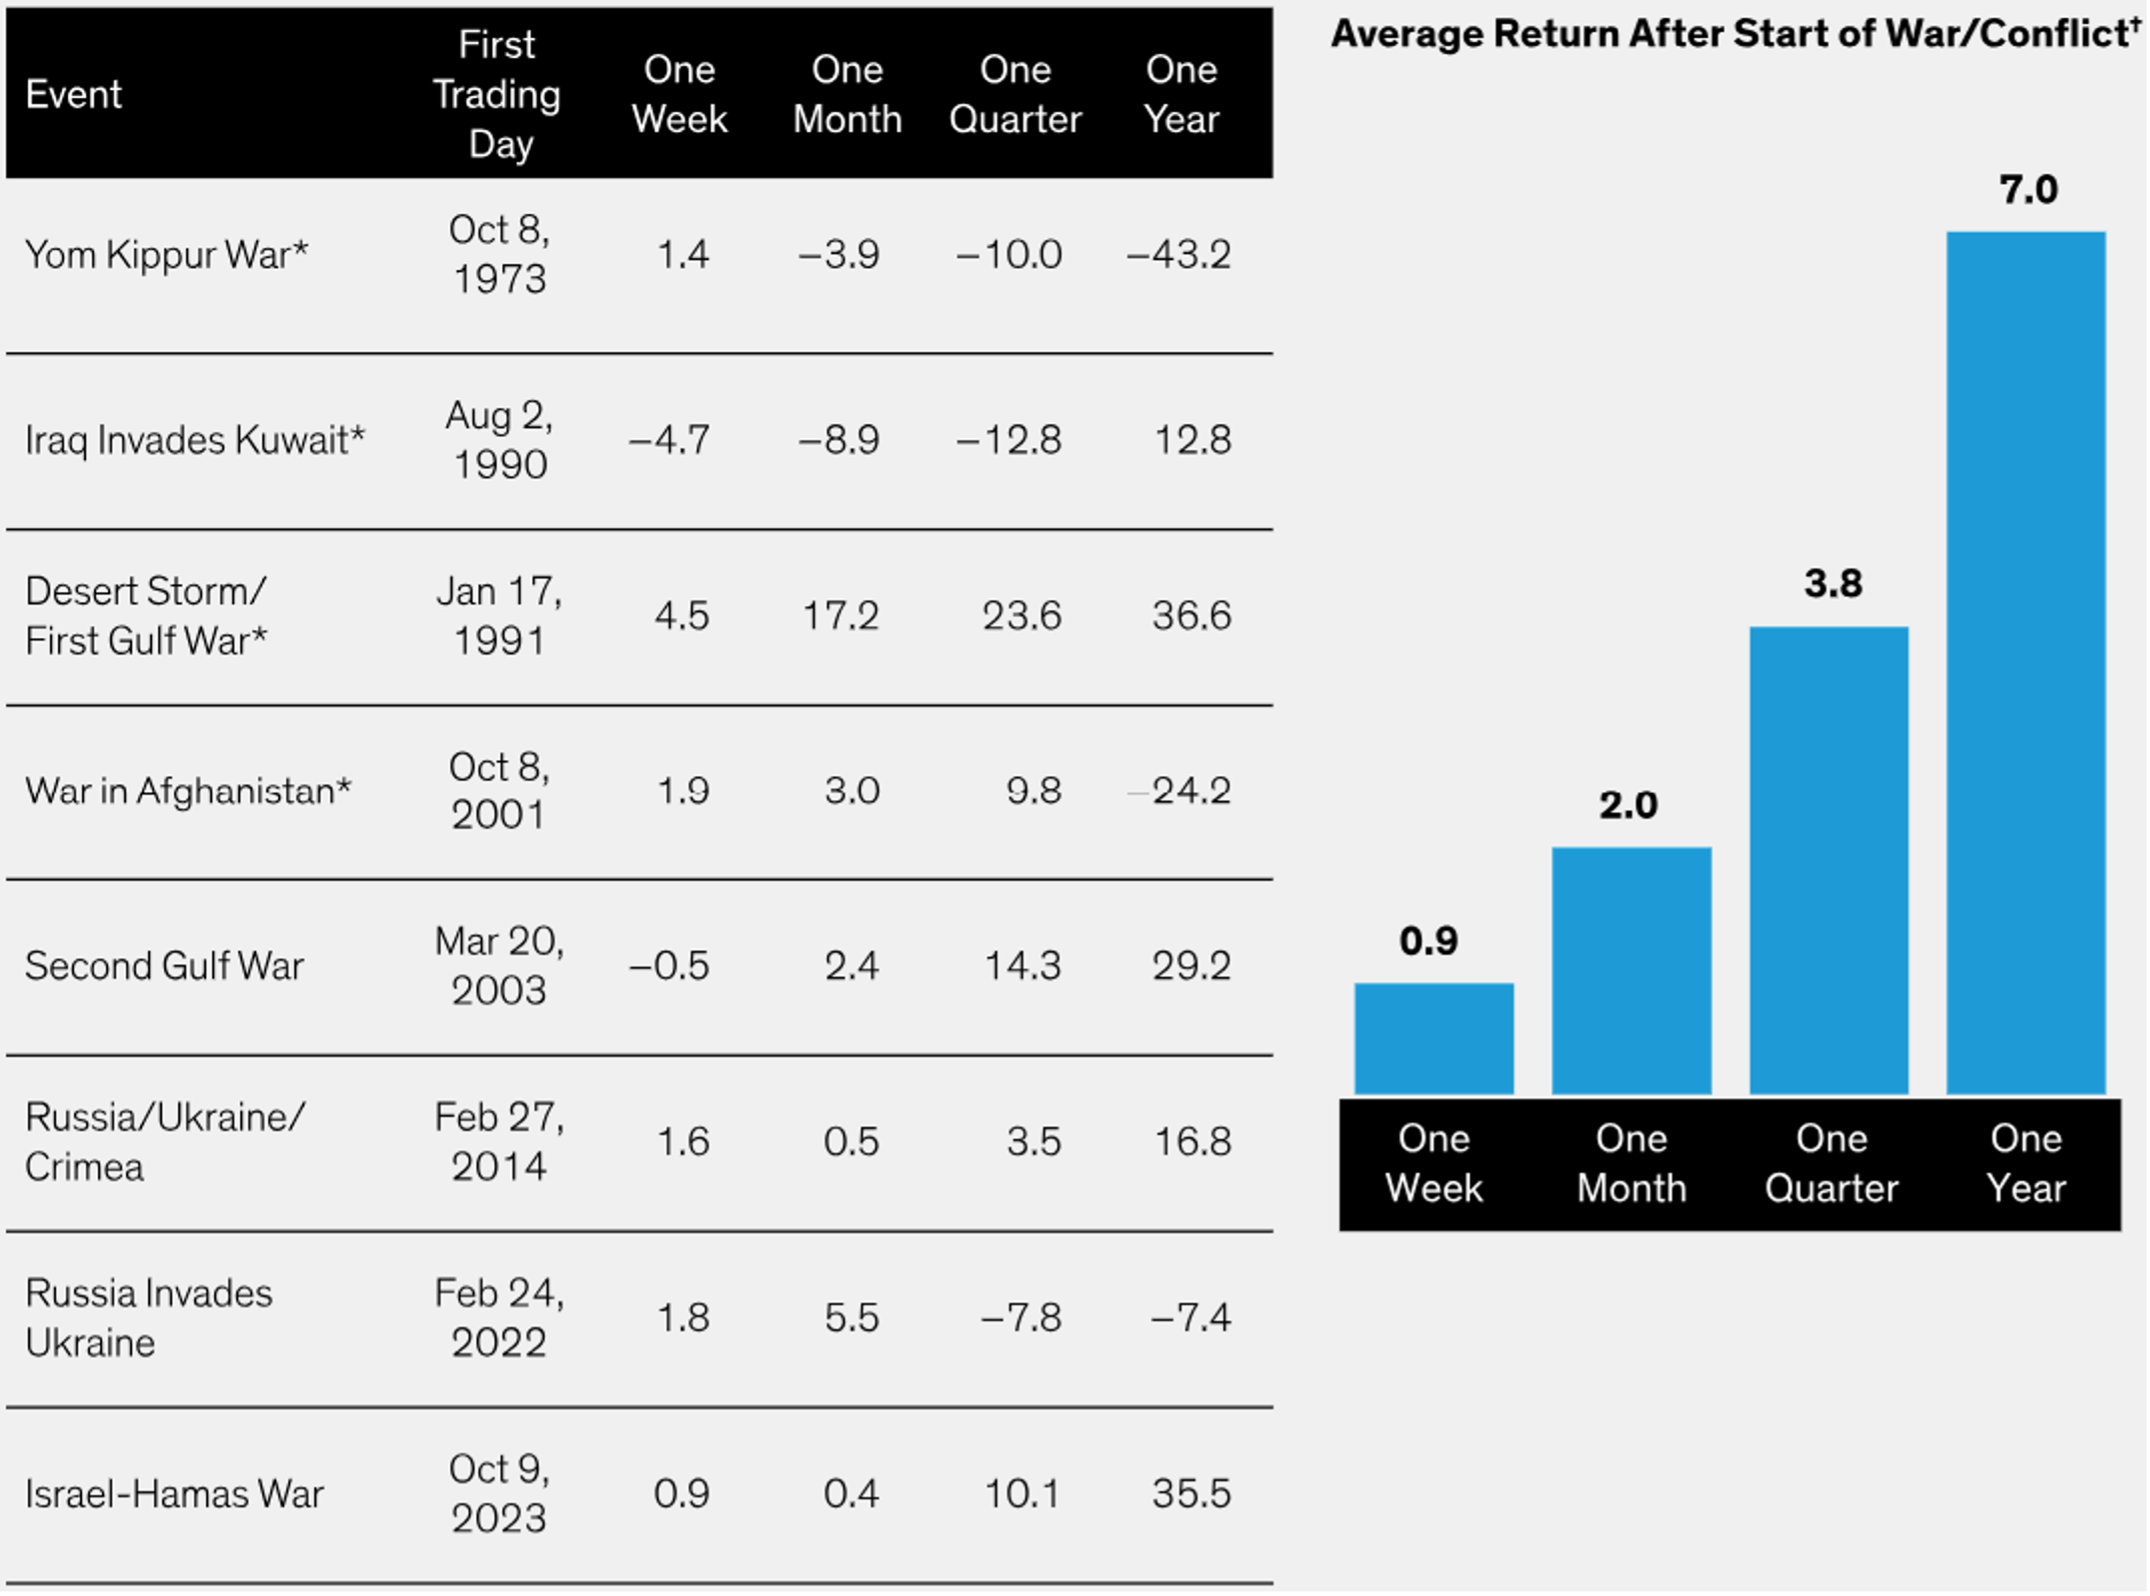
AllianceBernstein provides additional perspective, showing that wars over the past 50 years have generally not had a lasting negative impact on equity markets. In fact, the data suggests that the S&P 500 has delivered an average one-year return of approximately 7% following major geopolitical conflicts.
This resilience is consistent with the broader, long-term trajectory of the market. A historical view of the S&P 500 reveals a persistent upward trend punctuated by temporary declines. Notably, these downturns tend to form “higher lows” over time – an encouraging pattern that reflects the market’s ability to grow despite periodic disruptions.
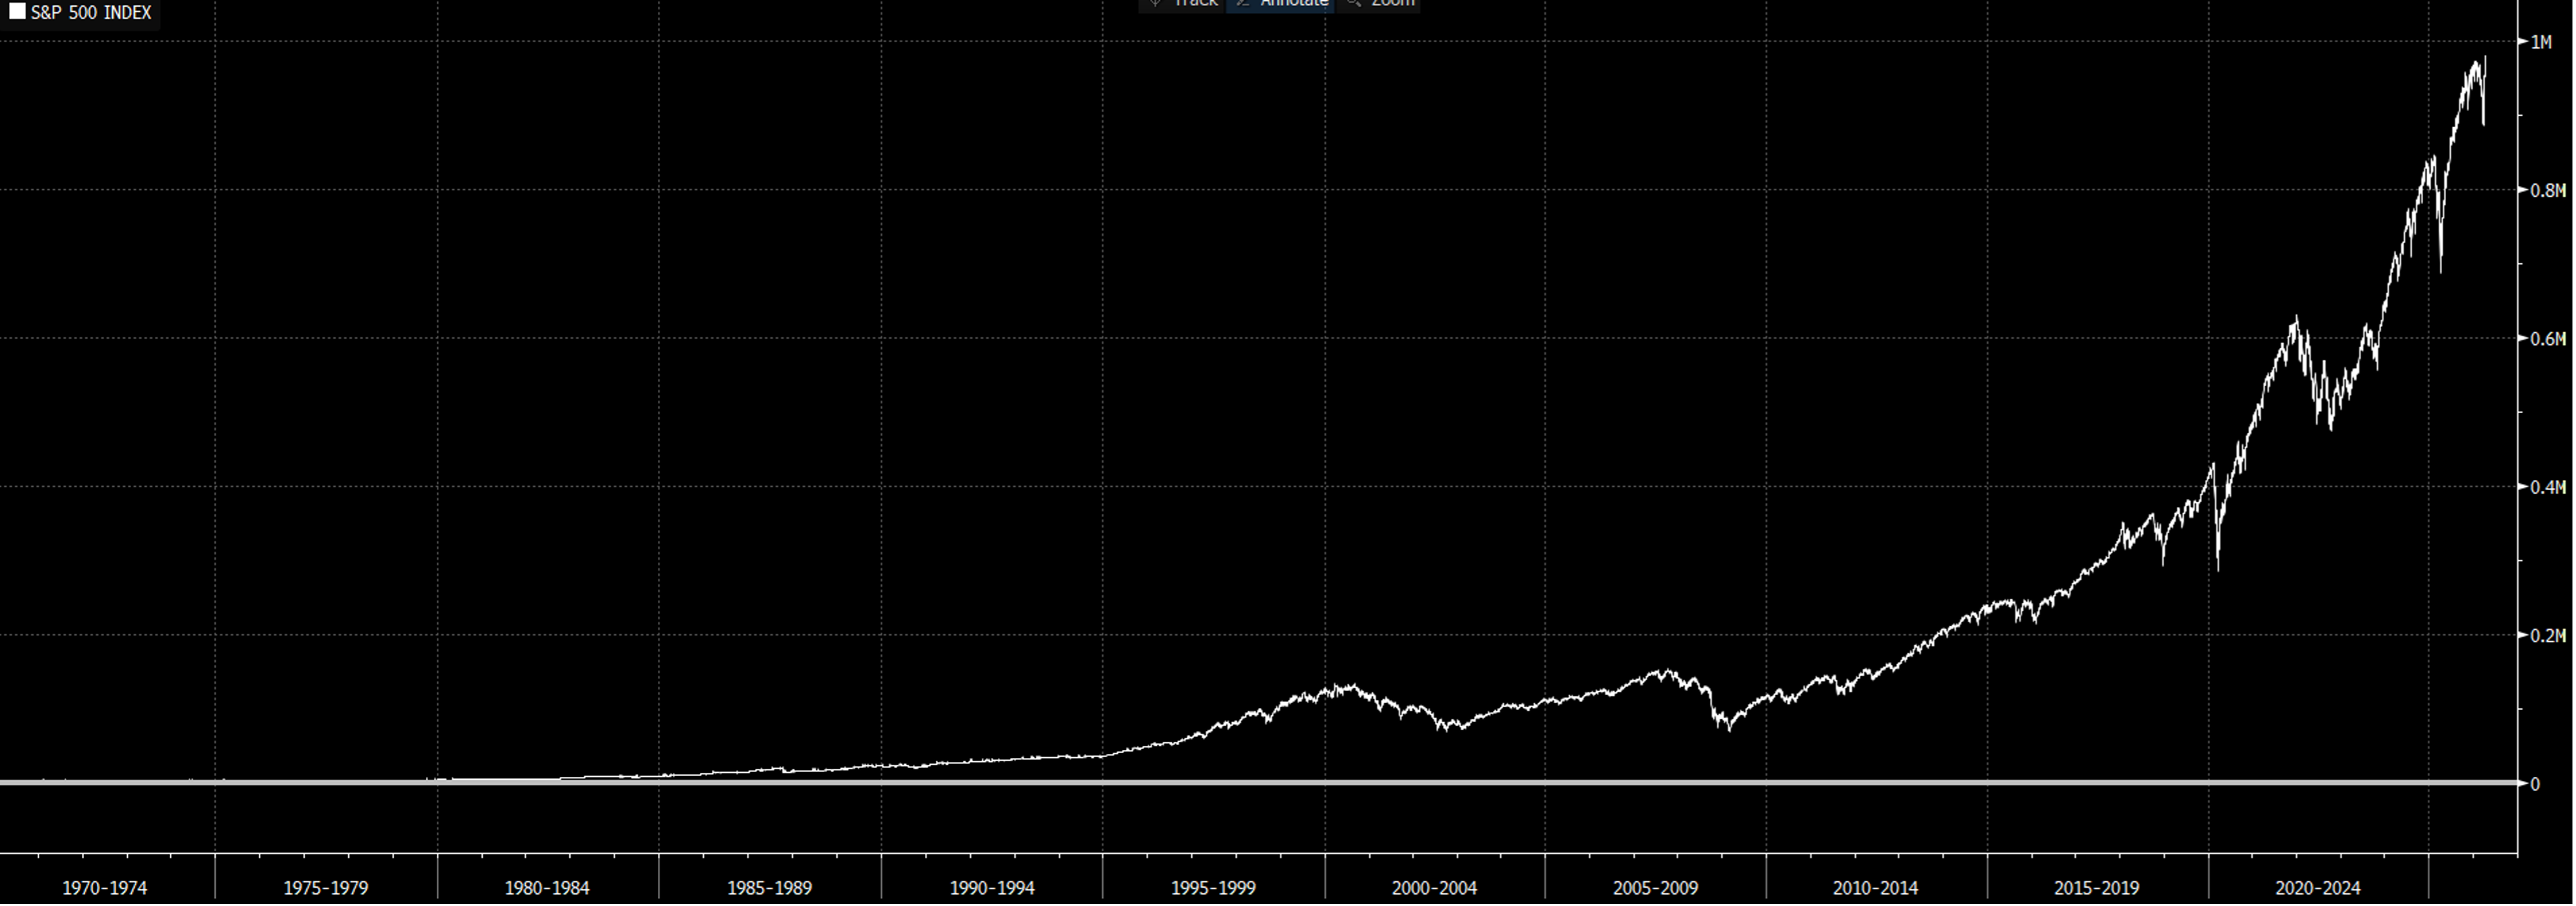
A long-term “growth of $10,000” analysis reinforces this point. Even when accounting for multiple global conflicts and economic downturns – some more severe than others – the market has demonstrated an enduring capacity to recover and advance over time.

Of course, past performance does not guarantee future results. Markets can behave unpredictably, especially in the short term. However, historical patterns offer valuable context for navigating periods of uncertainty.
In times of heightened uncertainty, it is easy to be influenced by fear. However, Scripture reminds us in 2 Timothy 1:7 that “God has not given us a spirit of fear, but of power and love and a sound mind.”
For faith-driven investors, this perspective is especially relevant. Rather than reacting to short-term volatility or fear-driven narratives, we are called to exercise discipline, wisdom, and a long-term mindset. Market fluctuations – particularly those tied to geopolitical events – are often temporary, even when they feel significant in the moment.
Maintaining a steady, long-term investment philosophy allows us to navigate these periods with clarity and confidence. When volatility arises, it can be helpful to remember: this too shall pass. With that perspective, you can maintain confidence in the midst of conflict.
1Historical S&P 500 Index prices are sourced from Yahoo!Finance: (https://finance.yahoo.com/quote/%5EGSPC/history/)
S&P 500 Index: A market-capitalization-weighted index of approximately 500 large U.S. companies across major industries, widely used as a benchmark for the overall U.S. stock market and/or large cap U.S. stock market.

W. Andrew Stoner has been with Inspire since 2022 and serves as VP of Portfolio Strategy & Research, overseeing both our Trading and Insight Research departments. Additionally, he manages Inspire’s Tactical Risk Management and Core/Satellite strategies, leads Inspire’s Index Committee, and serves on Inspire’s Engagement Committee.
Prior to joining Inspire, Andrew worked at a Louisiana-based RIA as their Chief Investment Officer and Lead Advisor, managing approximately $450 million of invested assets and implementing active equity strategies aligned with biblically responsible investing (BRI) values.
In 2013, Andrew received a B.A. in Business Administration with a concentration in Economics from Southeastern Louisiana University, where he met his lovely bride, Bethany. Bethany and Andrew tied the knot in 2015 and have since had two adorable children, Adelyn Grace and Liam Ross, who keep them busy with endless playtime and trips to the Audubon Zoo.
Aside from family fun, the Stoner Family is passionate about serving their community through their church, First Baptist Church Covington, and spending quality time with loved ones. For Andrew, his faith and family are at the core of all that he does, including his career.
With a background as a Youth and College Associate Pastor, Andrew has always been driven to integrate his love for Jesus into all aspects of his life. In 2014, he discovered the world of BRI and never looked back. Since then, Andrew has remained steadfast to the mission of inspiring transformation for God’s glory by empowering Christian investors through biblically responsible investing excellence and innovation.

Securities in the Index or in the Fund’s portfolio may underperform in comparison to the general securities markets or other asset classes. The Fund may focus its investments in securities of a particular industry to the extent the Index does. This may cause the Fund's net asset value to fluctuate more than that of a fund that does not focus in a particular industry. Fluctuations in the value of equity securities held by the Fund will cause the net asset value (“NAV”) of the Fund to fluctuate. The Fund is not actively managed and the Adviser will not sell shares of an equity security due to current or projected underperformance of a security, industry or sector, unless that security is removed from the Index or the selling of shares of that security is otherwise required upon a rebalancing of the Index as addressed in the Index methodology. Tracking error may occur because of imperfect correlation between the Fund’s holdings of portfolio securities and those in the Index. The Fund’s use of a representative sampling approach, if used, could result in its holding a smaller number of securities than are in the Index. To the extent the assets in the Fund are smaller, these risks will be greater.
Investors cannot invest directly in an index and unmanaged index returns do not reflect any fees, expenses or sales charges


Heading into 2026, investor sentiment was overwhelmingly optimistic. Markets were buoyant, economic conditions appeared favorable, and expectations for continued growth were high. However, that optimism was quickly disrupted.
On February 28, 2026, the Iran War began with Operation Epic Fury and the assassination of Iranian Supreme Leader Ali Khamenei. Since then, investor attention has been dominated by uncertainty surrounding the conflict, accompanied by a noticeable rise in market volatility.
Prior to the outbreak of hostilities, the S&P 500 Index stood at 6,878.88. Over the following 30 days, the index declined 7.8%, falling to 6,343.72 by March 30, 2026. Yet, just as quickly as the market fell, it rebounded – recovering to 6,886.24 by April 13. This marked a full recovery within just two weeks of the low and only 44 days after the initial event.¹
This naturally raises an important question: how does this period compare to past geopolitical conflicts?
Interestingly, the recent volatility aligns closely with historical patterns. As noted by LPL Financial, “Even in the face of more serious and prolonged geopolitical events, the stock market has demonstrated remarkable resilience. On average, the S&P 500 experiences a drawdown of approximately 7% and recovers within about 55 days.” Our current experience fits well within these historical averages.
Disclosure: All indexes are unmanaged and cannot be invested in directly. Past performance is no guarantee of future results. Events not labeled include Hungarian uprising ('56), Suez crisis ('56), Gulf of Tonkin Incident ('64), Six-Day War ('67), Yom Kippur War ('73), Israel-Hamas War ('23), U.S.-Israeli Airstrikes of Iran Nuclear Sites ('25). The modern design of the S&P 500 stock index was first launched in 1957. Performance back to 1950 incorporates the performance of the predecessor index, the S&P 90.
AllianceBernstein provides additional perspective, showing that wars over the past 50 years have generally not had a lasting negative impact on equity markets. In fact, the data suggests that the S&P 500 has delivered an average one-year return of approximately 7% following major geopolitical conflicts.
This resilience is consistent with the broader, long-term trajectory of the market. A historical view of the S&P 500 reveals a persistent upward trend punctuated by temporary declines. Notably, these downturns tend to form “higher lows” over time – an encouraging pattern that reflects the market’s ability to grow despite periodic disruptions.
A long-term “growth of $10,000” analysis reinforces this point. Even when accounting for multiple global conflicts and economic downturns – some more severe than others – the market has demonstrated an enduring capacity to recover and advance over time.
Of course, past performance does not guarantee future results. Markets can behave unpredictably, especially in the short term. However, historical patterns offer valuable context for navigating periods of uncertainty.
In times of heightened uncertainty, it is easy to be influenced by fear. However, Scripture reminds us in 2 Timothy 1:7 that “God has not given us a spirit of fear, but of power and love and a sound mind.”
For faith-driven investors, this perspective is especially relevant. Rather than reacting to short-term volatility or fear-driven narratives, we are called to exercise discipline, wisdom, and a long-term mindset. Market fluctuations – particularly those tied to geopolitical events – are often temporary, even when they feel significant in the moment.
Maintaining a steady, long-term investment philosophy allows us to navigate these periods with clarity and confidence. When volatility arises, it can be helpful to remember: this too shall pass. With that perspective, you can maintain confidence in the midst of conflict.
1Historical S&P 500 Index prices are sourced from Yahoo!Finance: (https://finance.yahoo.com/quote/%5EGSPC/history/)
S&P 500 Index: A market-capitalization-weighted index of approximately 500 large U.S. companies across major industries, widely used as a benchmark for the overall U.S. stock market and/or large cap U.S. stock market.
.png)


.png)